

Model
See the end of a trade — before you ever place it
Build any options strategy with a few clicks and instantly see exactly what you can make, what you can lose, and what has to happen for it to work — no spreadsheets, no math.
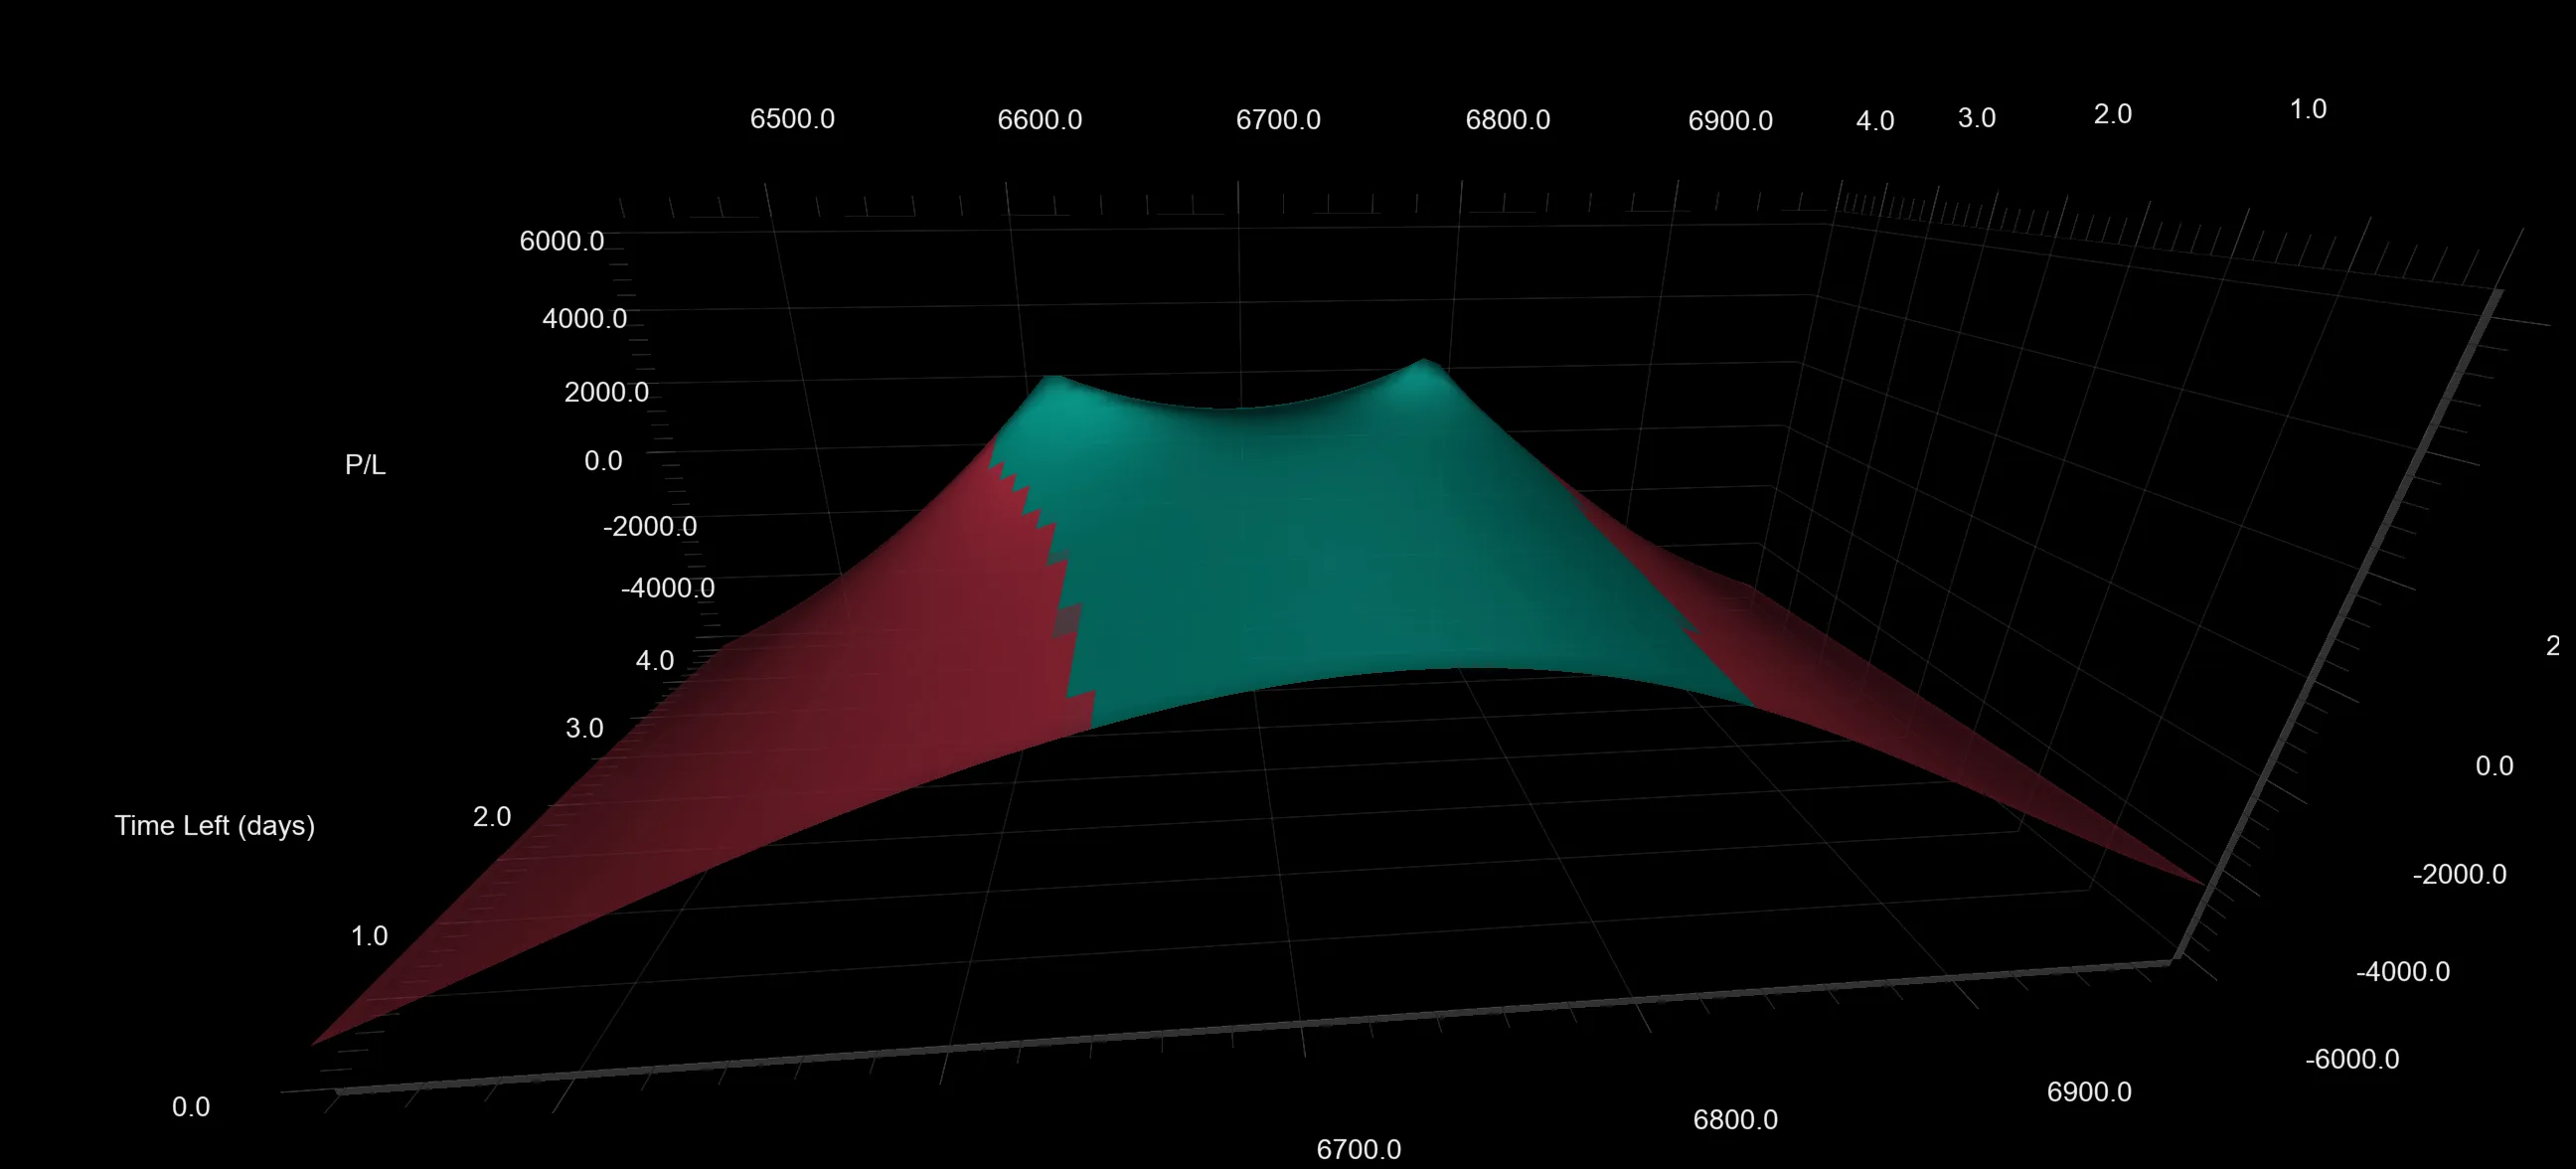
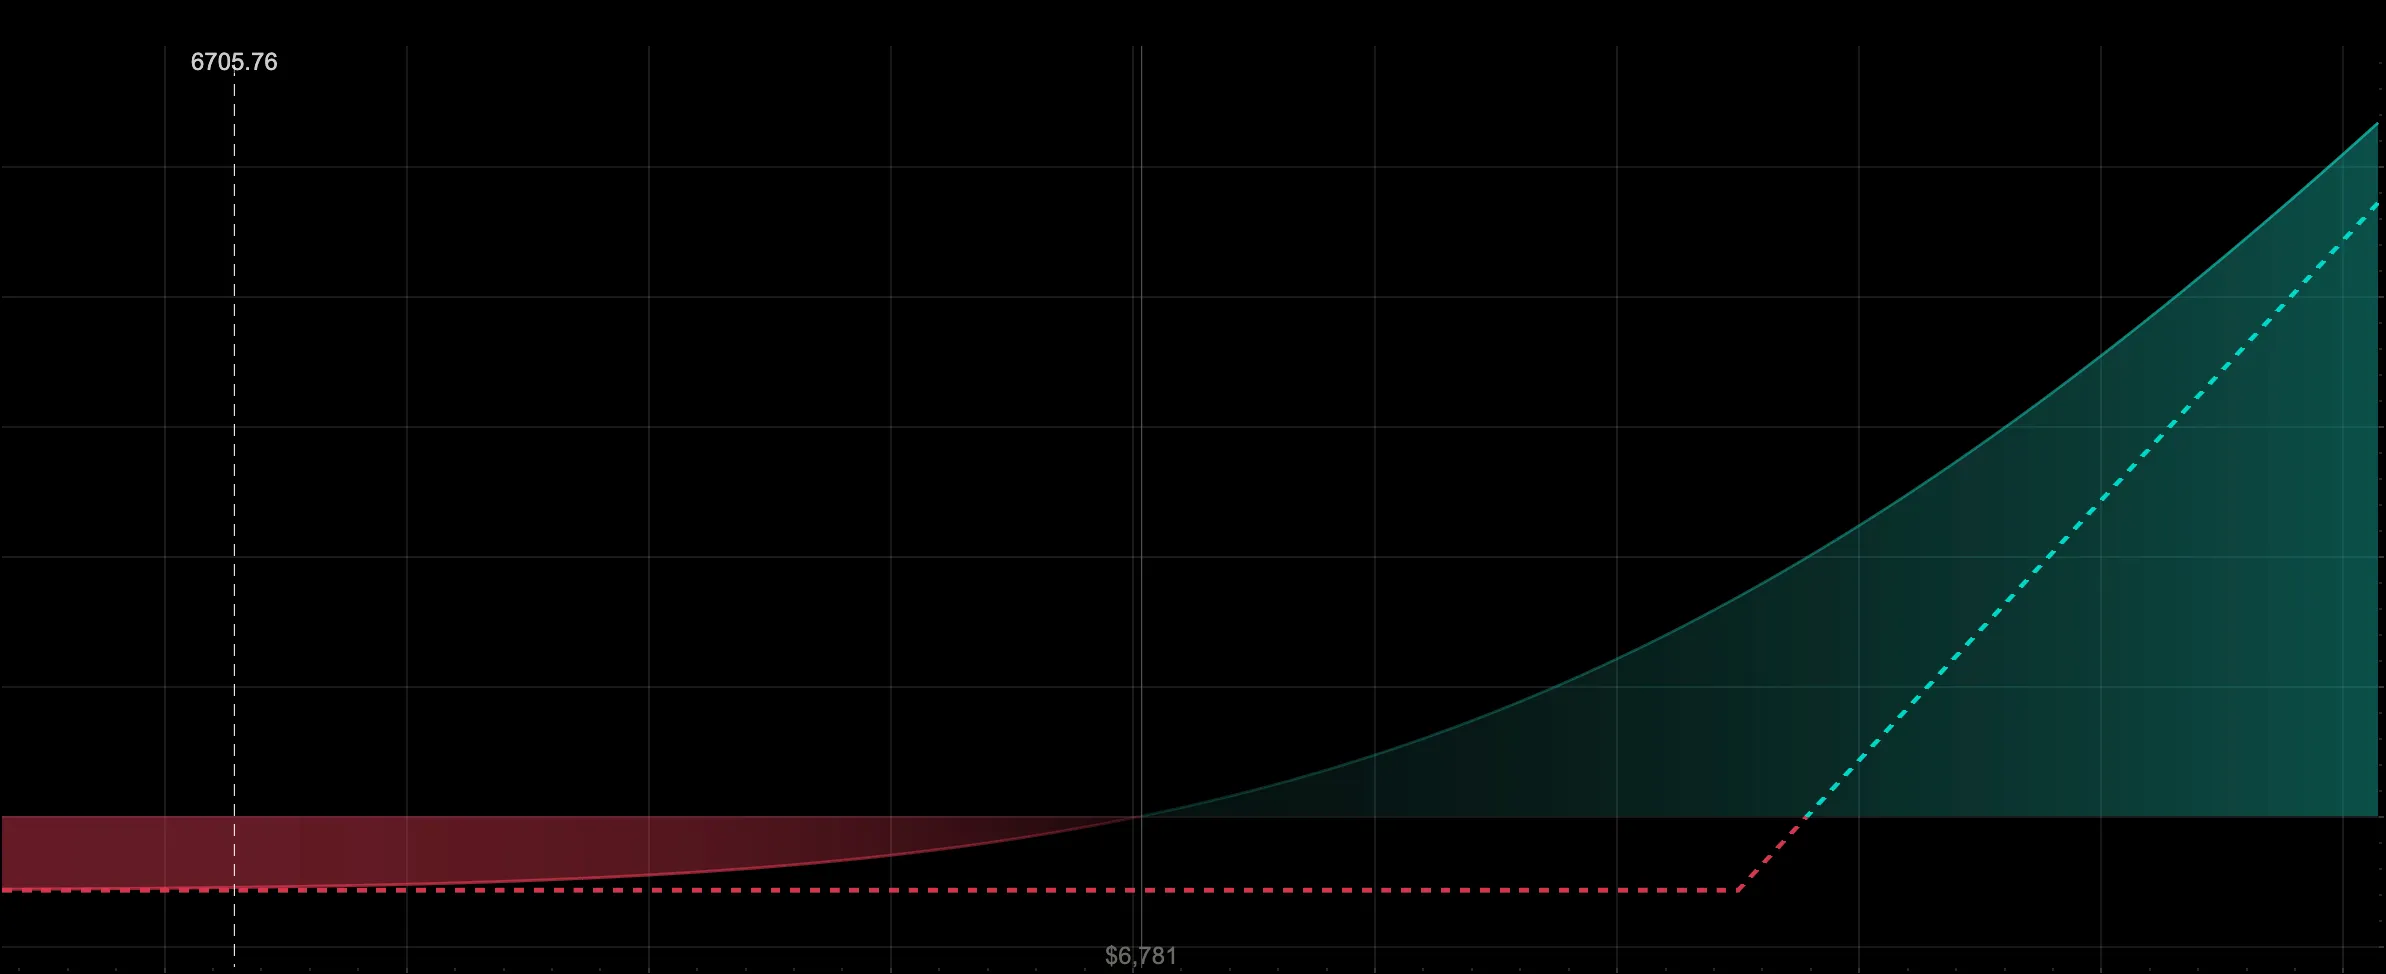
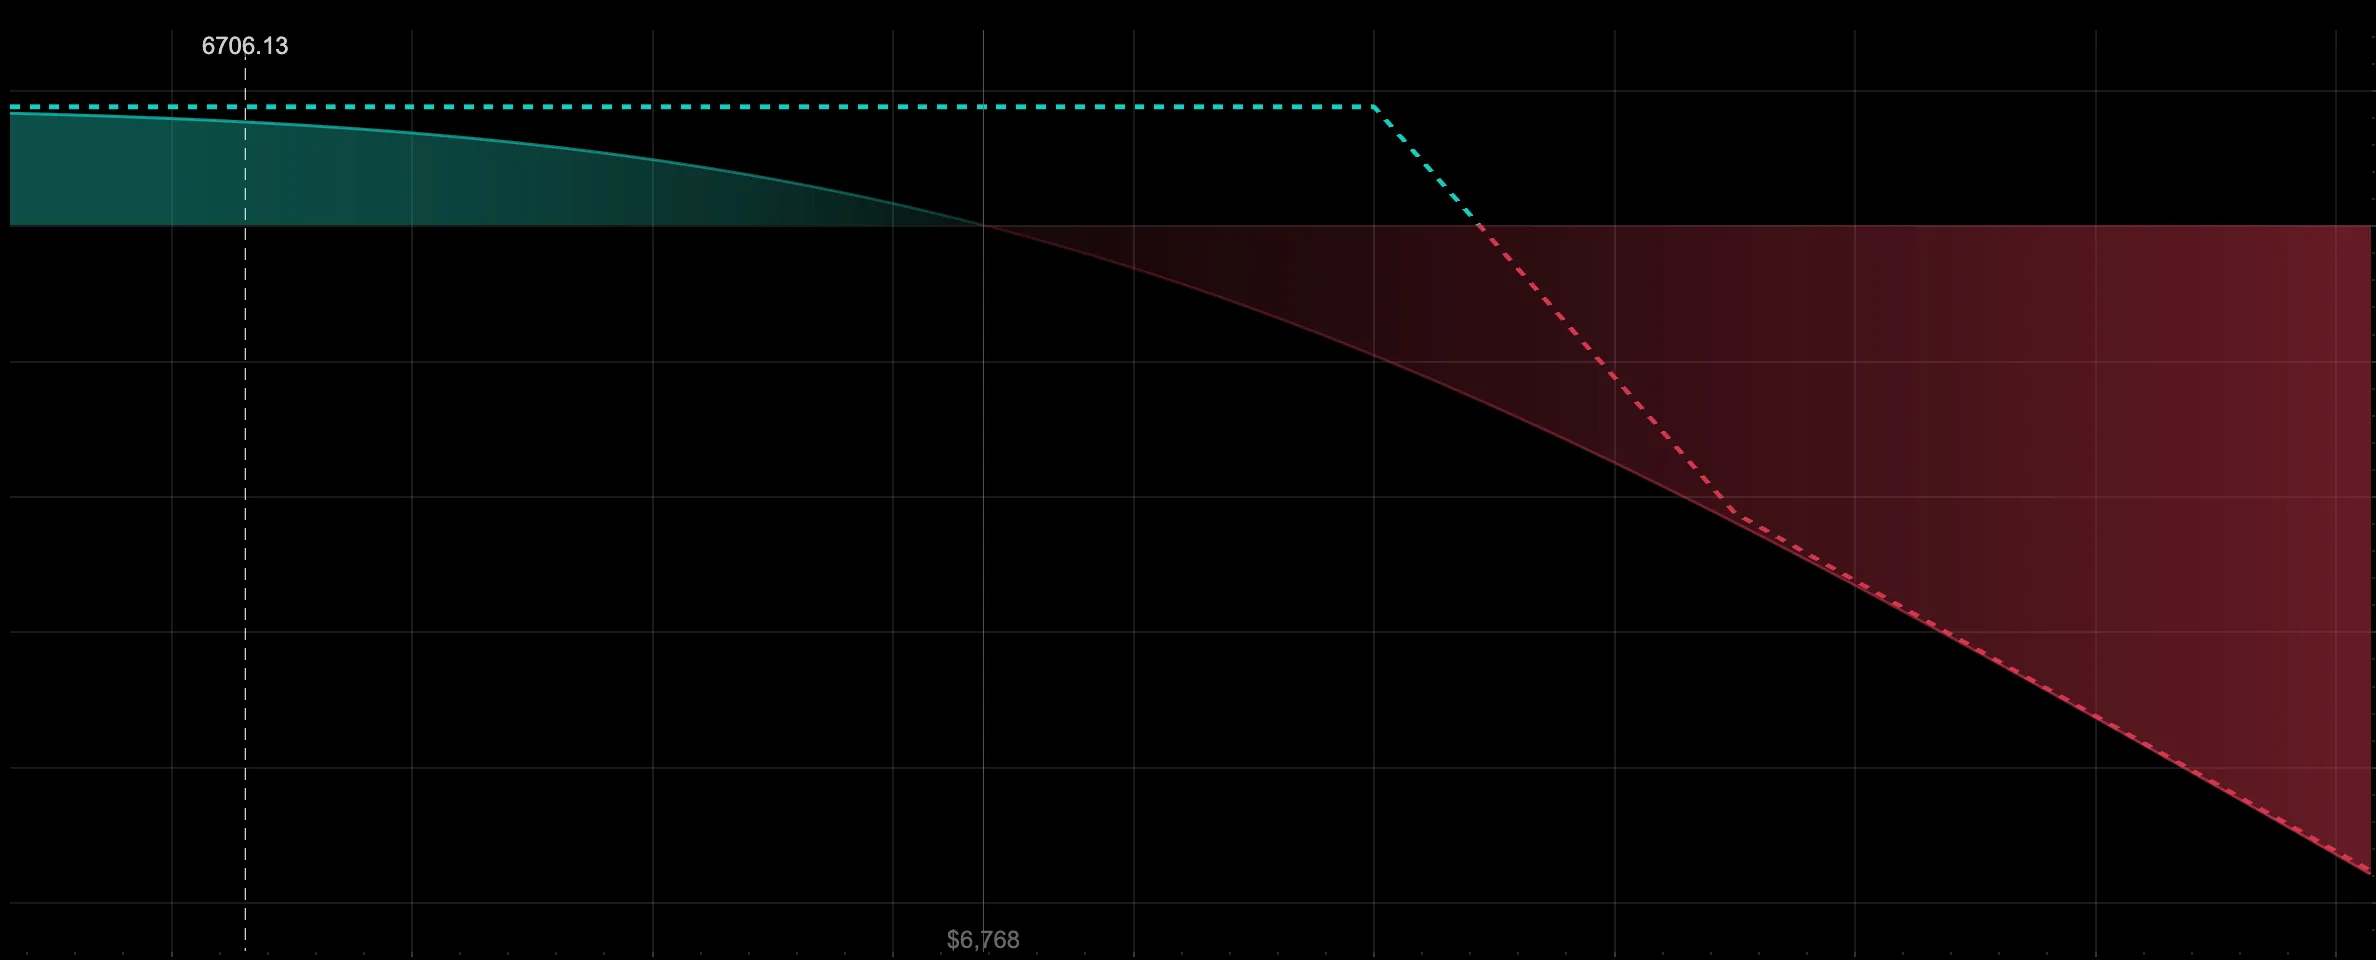
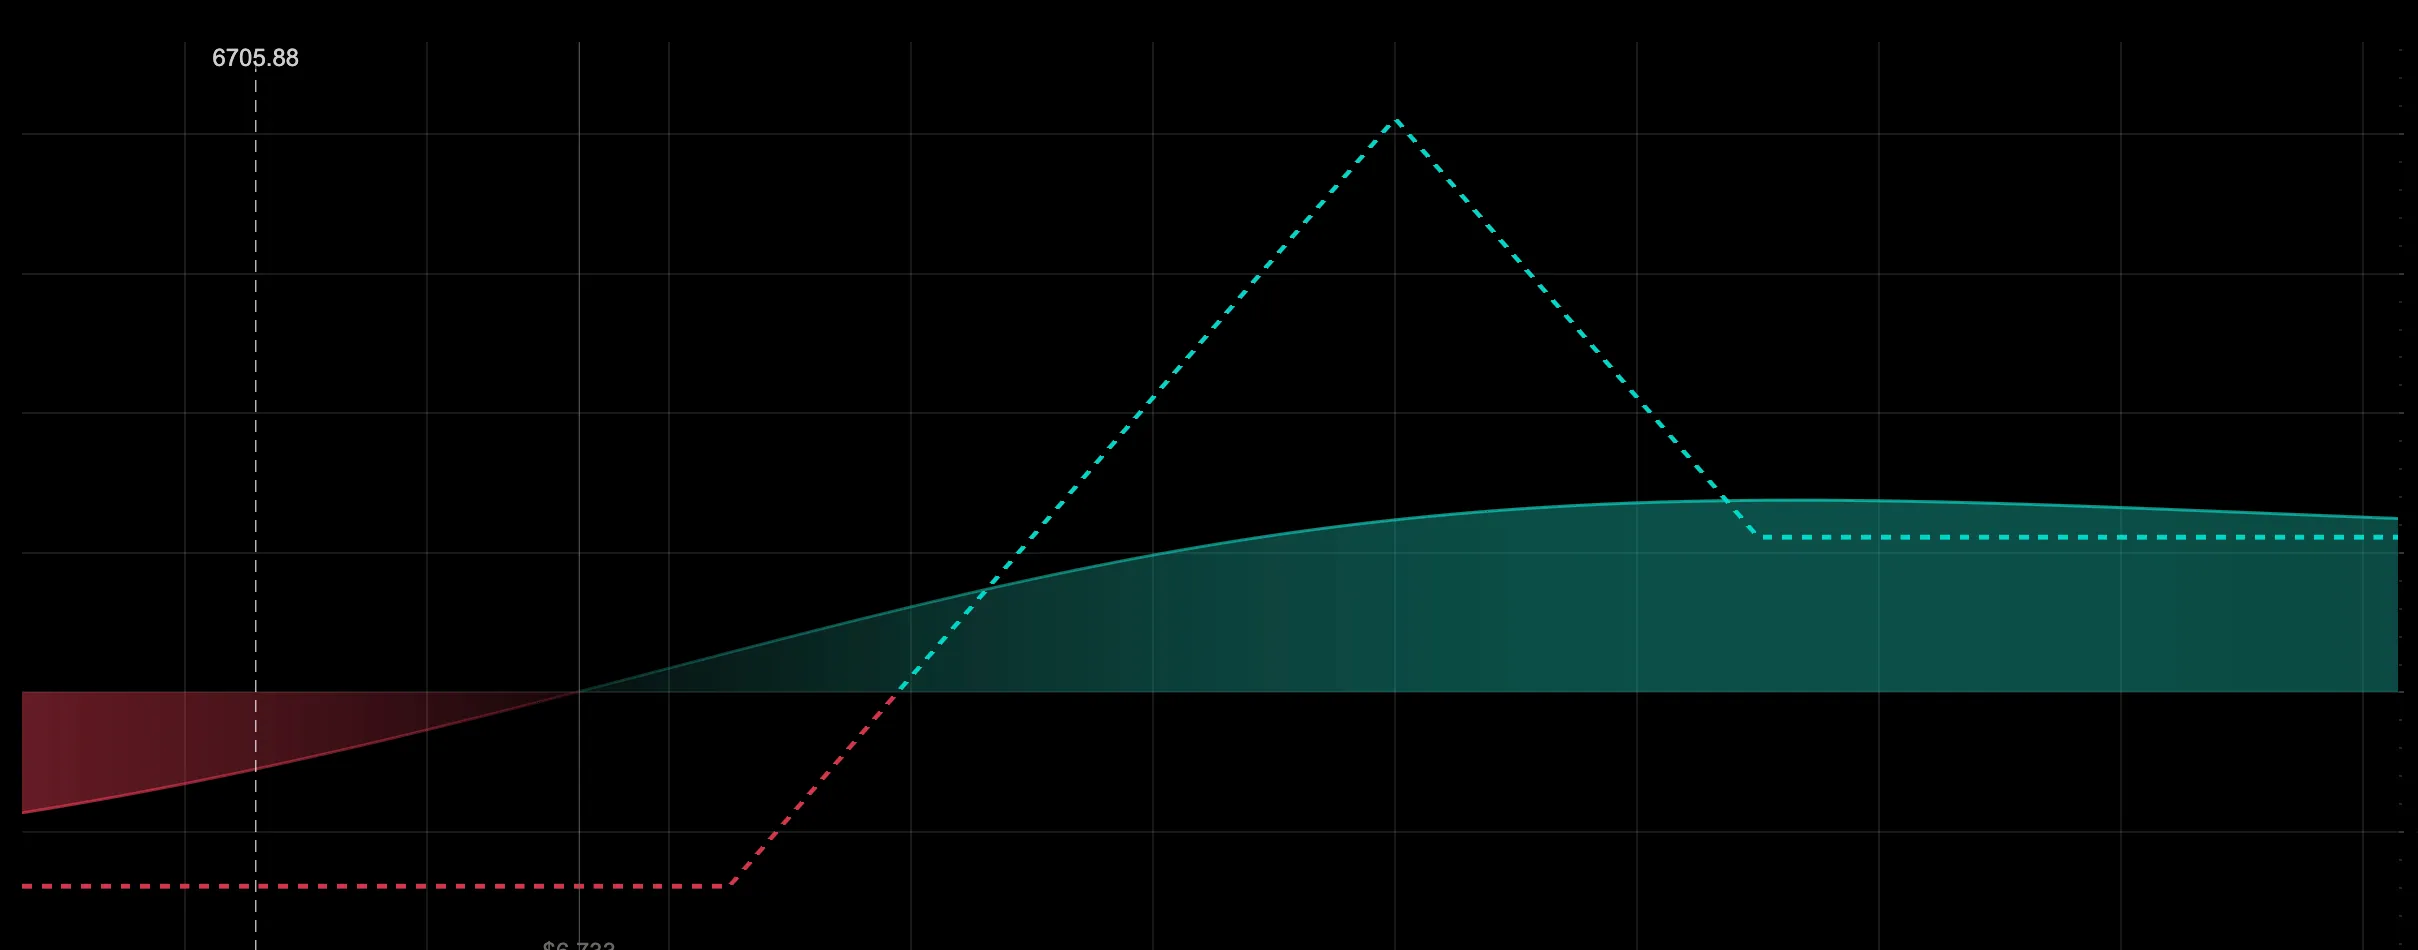
- Build any spread or strategy in seconds with a few clicks — no complicated formulas
- Instantly see exactly how much you can make, how much you can lose, your breakevens, and what has to happen for the trade to work
- Watch your trade play out across calm markets, a volatility spike, or even a crash — by dragging time, price, and implied volatility
- Read the full Greeks at a glance — Delta, Gamma, Theta, Vega, and Rho — to understand what's really driving your P/L
- Save, tweak, and track a position through its entire life, and share it with a trading partner
It's like a flight simulator for options traders: practice as much as you want, make all your mistakes in here, and test your assumptions before you put real capital at risk.
Ready to finally "get" options instead of just copying what you see online?
Get started- Spread, condor, fly, or custom combo you can build
- Any
- P/L plus first and second order Greeks — delta, gamma, theta, vega, rho, vanna, and charm
- 8 metrics
- Visualize risk across price and time
- 2D + 3D
- Make your mistakes here, not in your account
- $0 risk
How it works
Understand any trade in three steps
Build it with a few clicks
Add legs to assemble any spread or strategy — a call debit spread, an iron condor, a calendar — no formulas required.
See the whole picture
A live payoff diagram, full Greeks, breakevens, and max profit/loss appear instantly, in 2D or 3D.
Stress-test the outcome
Drag time, price, and implied volatility to watch the trade behave in calm markets, a vol spike, or a crash — before you risk a dollar.
Everything you can do with Modeling
- Live payoff diagrams
- Watch profit, loss, and breakevens redraw in real time as you build and adjust the trade.
- 2D and 3D views
- Flip between a classic 2D payoff curve and an immersive 3D surface to see risk across price and time.
- Full Greeks
- Delta, Gamma, Theta, Vega, and Rho — plus the second-order Greeks Vanna and Charm — shown for the whole position.
- What-if scenarios
- Drag time to expiration, the underlying price, and implied volatility to stress-test any outcome.
- Theoretical + live pricing
- Black-Scholes modeled P/L on the chart, plus real-time P/L from live market data in the sidebar.
- Save, track & share
- Save models, adjust them as the trade evolves, and share them with a trading partner.
Modeling questions, answered
How are prices and Greeks calculated?
Modeling uses the Black-Scholes model to calculate estimated option prices and Greeks (Delta, Gamma, Theta, Vega, and Rho). Implied volatility values come from a market data provider, so the model is anchored to real market conditions.
Why does the chart P/L differ from the sidebar P/L?
The chart shows theoretical profit and loss calculated with the Black-Scholes model, while the sidebar shows real-time P/L based on live market data. Seeing both side-by-side is how you learn where theory and the live market diverge.
Do I need to know the math?
No. That's the point. You build the trade visually and Modeling does the math — payoff, breakevens, Greeks, and scenarios — so you can focus on understanding the trade instead of wrestling a spreadsheet.
Can I add Modeling to my existing plan?
Yes. Modeling is included with Plus and Premium, or on its own as Lite. The self-service billing portal in the web app lets you change your tier at any time, and the change is prorated against your current subscription.
Finally understand the trade before you place it
Model your next idea, drag the market around, and test your assumptions before putting capital at risk.