Analyze Tab: Monte Carlo, MAE/MFE and Profit Factor in Option Omega
David Romeo walks through Option Omega's new Analyze tab on an MEIC backtest, from a 1.05 profit factor and MAE/MFE to Monte Carlo and synthetic losses.
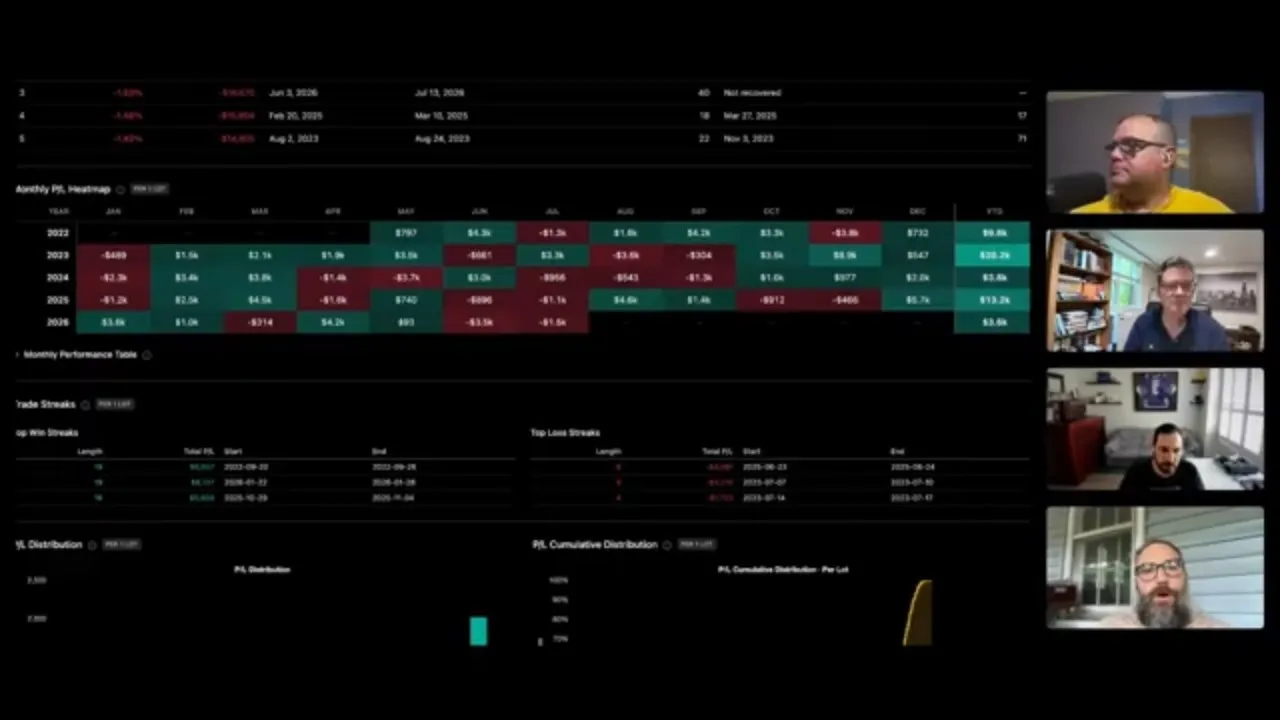
A backtest made about $100,000 on a $1 million account with a MAR of about 1.2. It is not a terrible headline. But when David Romeo, creator of TradeBlocks, ran it through Option Omega’s new Analyze tab, the details told a different story: a profit factor of about 1.05, long stretches in drawdown, and negative expectancy once just 1% of trades were assumed to fail at max loss.
That is the job of the Analyze tab: show what is happening underneath a backtest’s headline numbers. Troy credited Romeo as the architect of much of it, inspired by TradeBlocks. Troy’s plan for the stream was simple: share one plain MEIC backtest and let Romeo walk through how he reads each section.
The example backtest
Troy shared a simple MEIC backtest. Romeo was upfront that it is not a great test. Over the test period it lost to the risk-free rate, as the Sharpe and Sortino ratios show.
| Setting | Value |
|---|---|
| Strategy | MEIC on SPX |
| Entries | Twice a day |
| Sizing | 1% of the portfolio (percent scaling) |
| Stops | 300% of credit on the put side, 150% on the call side |
| Trades | Over 4,000 |
| Headline result | About $100,000 on $1 million, MAR about 1.2, about 2.3% a year |
Romeo noted that because of how Option Omega groups legs for exits, the sample size is about twice what you might expect.
Test at percent scaling, analyze at one lot
The Analyze tab has a toggle to normalize results to a one-lot. Romeo recommends testing with percent scaling and analyzing at one lot.
His reasoning: percent scaling shows sizing and sequence risk that fixed contract sizing hides, but over a long backtest it also inflates the numbers. Analyzing at one lot shows whether a few lucky trades blew everything out of proportion. This test never traded more than two lots, so the toggle changed little. On trades with changing contract counts, such as double calendars, the difference can be large.
Profit factor and payoff ratio
Profit factor came in at about 1.05, meaning the backtest made about $1.05 of gross profit for every $1 of gross loss. Romeo called the edge on this trade “really thin, almost negative expectancy.”
Asked what a decent MEIC looks like, Romeo said about 1.25 “isn’t the worst” and gives some room. He trades double calendars, not MEIC, but said he can get his own MEIC backtests to about 1.25 without gaming them, and has trouble getting higher.
Payoff ratio is your average winner divided by your average loser. Here it was about 0.5, meaning losers were roughly twice the size of winners. Romeo said that’s something you’ll see on a lot of premium-selling trades. Romeo’s rough guide:
| Trade type | Payoff ratio Romeo looks for |
|---|---|
| Premium selling, such as MEIC | Around 0.5 |
| Debit trades, such as double calendars | 1 or above |
In Romeo’s reading, a low payoff ratio hints that there are probably some extended drawdown periods to look at.
Drawdowns and recovery time
The drawdown view confirmed that warning. “You’re almost always in drawdown,” Romeo said.
- The fourth-largest drawdown recovered in 17 days.
- The largest, during the yen carry unwind, took months to recover.
- At the time of the stream, the backtest was about 40 days into a drawdown that hadn’t recovered yet.
For a strategy earning about 2.3% a year, Romeo found that a lot of time underwater.
Heat map and monthly performance
The heat map shows results by month, which makes seasonality easy to spot. Romeo said it was one of his favorite features in TradeBlocks. On this backtest, June and July stood out as weak. He suggested blacklisting those dates and re-running the test to see the effect.
The expandable monthly performance table goes deeper. Romeo noted that regimes do not follow calendar months, so it is worth checking around events such as options expiration or FOMC too.
P&L distribution
The P&L distribution shows how often trades win and by how much, without tallying the trade log by hand. Romeo read this one as most entries losing, with the winners larger when they came. In MEIC terms, Romeo explained, if the market picks a direction, one side gets stopped. If it stays range-bound, most of the entries win. The chart shows which is happening across multiple-entry strategies.
MAE/MFE distribution
OO has gotten a lot of questions about this section.
- MAE (maximum adverse excursion): the largest unrealized loss a trade had while open.
- MFE (maximum favorable excursion): the largest unrealized gain a trade had while open.
A trade’s P&L travels during the day. Comparing MAE and MFE, including the ratio scatter plot, helps show where a profit target or exit might belong. On this MEIC, the stopped trades lined up where the stops were set. But some of them had first been 50%, 60% and even up to 80% profitable before reversing and getting stopped out.
MAE and MFE are percentages of what you put at stake, so credit and debit trades read differently:
| Credit trade | Debit trade (e.g. double calendar) | |
|---|---|---|
| Denominator | Credit collected | Debit paid |
| MFE | Capped at 100% | Unbounded. A good DC can hit 100%, 150%, 200% |
| MAE | Open-ended, up to the width (stops and slippage change it) | Roughly -100%. You lose about what you paid |
Romeo’s analogy: a credit trade has “a ceiling and a trap door,” and a debit trade has “a floor and an open sky.”
Return on margin and Reg T
Return on margin asks whether “the juice is worth the squeeze.” Romeo has backtested trades with great profit factors that would take his entire account in margin, even at 1% to 2% sizing.
Option Omega uses Reg T margin, not portfolio margin. Troy explained that broker portfolio margin calculations all differ, and brokers can change margin intraday during events. Dan, also on the stream, liked Reg T because it gives a level playing field and stresses a strategy. Romeo added that portfolio margin does not change much for MEIC, and can lead people to think they can trade much bigger than they can.
On this test, the median return on margin was well above the average. In a healthy distribution, Romeo said, the two sit near each other. Here, a minority of trades made the P&L, and much of what the typical trade earned was handed back by the losers. That is a negative skew.
Monte Carlo simulation
Troy called this the part he would name the “Romeo simulation.” Monte Carlo takes the trade log and reshuffles it into thousands of different orders. Troy said the number of resamples is dynamic and is scaled down for very heavy tests.
The goal is to find path dependency. If a cluster of losses hits early, does the strategy recover? A small dip in an equity curve can look harmless until a Monte Carlo puts it at the start, especially with larger sizing.
- The chart shows the average path across all the resamples, rather than every individual path.
- Users can resample individual trades or blocks of trades. Stationary blocks is the recommended option, and Romeo agreed most people should use it.
Synthetic loss injection
Romeo called this his favorite feature and “probably the most important thing” in the Analyze tab.
As Romeo sees it, every backtest is fit to some degree: tighter stops, outlier filters, exits on VIX or on the short/long ratio. And a backtest assumes those exits work. Synthetic loss injection asks what happens when they fail and a trade takes a max loss. In Romeo’s view, the cause is almost always gaps, or a bid/ask that blows out so you cannot get your stop.
On this MEIC, injecting max losses on just 1% of trades produced negative expectancy. With a profit factor near 1.05, it did not take much. Romeo’s verdict: “Your edge is fragile.”
Romeo uses it as a confidence test. If a strategy can absorb 2%, 3% or even 5% synthetic losses, he considers it robust and may size it a bit larger than his other strategies. If not, he might switch to fixed contract sizing.
Key takeaways
- Romeo recommends testing with percent scaling, then analyzing at one lot to strip out compounding luck.
- Romeo called a profit factor of 1.05 a thin edge. He can get his own MEIC backtests to about 1.25.
- Romeo considers a payoff ratio near 0.5 common for premium selling; on this backtest it came with long stretches in drawdown.
- On this MEIC, MAE/MFE showed some trades that were 50% to 80% profitable before getting stopped out.
- Injecting synthetic losses on 1% of trades turned this backtest negative. Romeo looks for strategies that survive 2% to 5%.
The Analyze tab is in every backtest in the Option Omega backtester. Troy noted that TradeBlocks still does much more than the Analyze tab, and the two work well together. For an example of Monte Carlo and edge decay in TradeBlocks, see how to backtest an SPX put-selling strategy with AI. Start a free trial to run it on your own saved tests.
Watch the full video: Monte Carlo, MAE/MFE and much more! (Inside the New Analyze Tab).
Backtest results are hypothetical and do not guarantee future performance. Options trading involves substantial risk.