How to Backtest an SPX Put-Selling Strategy With AI (and Why It Said Not to Trade It)
We connected AI to the Option Omega backtester and tested a simple SPX put-selling strategy. The first results looked promising, but further checks gave us reasons to pass.
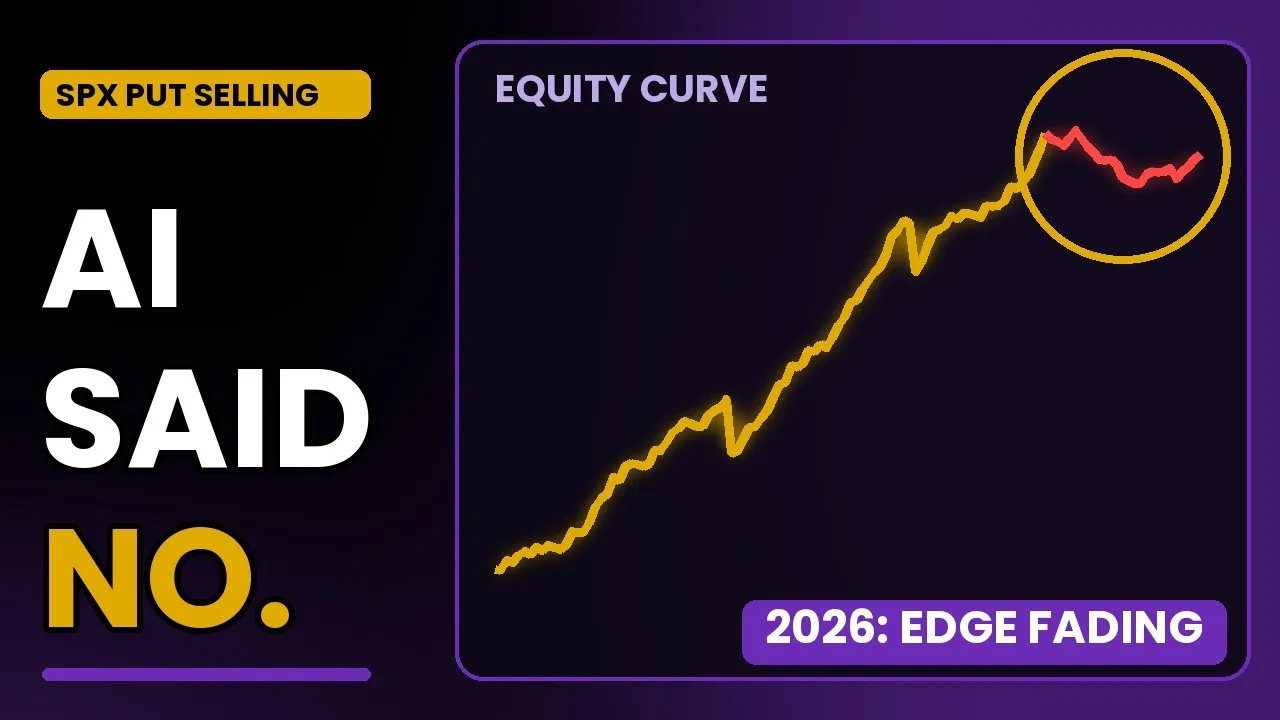
We gave AI a plain SPX put-selling backtest and asked it to find an edge. In about two minutes, it identified a promising filter, investigated how sensitive the result was to the settings, calculated the exposure for a hypothetical $25,000 account, and then recommended we not trade it.
That last part is what really made the demo interesting. A promising equity curve gave us a reason to investigate further. Troy and David Romeo, creator of the free, open-source TradeBlocks, worked through the results using the Option Omega MCP, checking the settings, exposure, recent performance, and sensitivity to slippage.
The starting backtest: “just sell puts”
The baseline was intentionally simple. It is not a strategy we would run as-is, which makes it a good test of whether AI can improve it honestly.
- Underlying: SPX, 0DTE
- Entry: every trading day at 9:32 ET, the earliest automated entry Option Omega allows
- Position: put credit spread, 15-delta short leg, 10 wide
- Size: 1% of the portfolio per trade
- Exit: none. Held to expiration, since SPX is cash-settled
- Date range: full available history through October 2026
With the backtest saved, Romeo copied its URL into Claude and asked it to pull the results into TradeBlocks. TradeBlocks calculates extra statistics that are not in the standard Option Omega results page, and Claude can build charts from them on request.
Step 1: Test the day of the week
The first question was whether some weekdays performed better than others. Claude broke out results by entry day and found Mondays and Fridays strongest. It also went further than asked, building an interactive equity chart that compared variants against the all-days, no-stop baseline.
The best variant traded only Monday, Tuesday, and Friday. But that filter removed almost half the trades. Fewer trades means less evidence, so a day-of-week edge deserves suspicion until it is tested further.
Step 2: Add a VIX overnight gap filter
Next, we tested whether entering after an overnight rise in VIX changed the results. This is a very common thought among retail traders—sell options when vol is high. The filter limited entries to mornings when VIX had gapped up.
Of five thresholds tested, entering only after VIX gapped up 3% or more gave the strongest result and cut drawdown significantly. This is where the AI earned its keep. Without being asked, it flagged its own caveats:
- The 3% filter trades rarely, so the data is thin
- The result is borderline statistically
- Picking the best of five thresholds flatters the winner
In other words, it acted like a risk manager before anyone asked it to.
Step 3: Test a wider range of VIX thresholds
A single good threshold proves little. If 3% looks good but 2% and 4% do not, that raises questions about how much the result depends on the specific threshold. Similar results across nearby settings provide more context, but don’t establish an edge on their own.
So the next step was a wide sweep: every VIX gap threshold from 0% to 8%, run through the Optimizer. The result changed the conclusion. The 0% threshold, meaning any overnight VIX move up, performed best. Compared with the baseline it added P&L, raised MAR, and cut max drawdown.
The wider sweep supported the idea that the overnight VIX move mattered in this backtest, but gave us less reason to favor 3% specifically. Searching a few settings and keeping the best one can lead to an overfit backtest. A wider sweep helps users see whether the result depends on one particular setting, though it doesn’t rule out overfitting.
As Troy put it during the demo, a check like this used to take hours of clicking. With the MCP it took about two minutes.
Step 4: Calculate the exposure for a $25,000 account
Romeo asked what one spread would put at risk relative to a hypothetical $25,000 account. Claude used TradeBlocks to calculate the exposure.
| Item | Value |
|---|---|
| Max risk per spread | about $900 |
| Share of a $25,000 account | about 3.6% |
| Credit per spread | about $100 |
| Worst single loss in the backtest | about 4% of the account |
In this example, each spread collected about $100 against roughly $900 of maximum loss before costs. That imbalance matters when interpreting the win rate: a full loss can offset several winners.
Step 5: Examine recent performance for edge decay
The equity curve looked fine at a glance, but it seemed to flatten in 2026. Romeo ran TradeBlocks’ edge decay tools, which include a Monte Carlo simulation and a walk-forward analysis, to check whether that was real.
The recent results were weaker. Profit factor and net P&L both fell in 2026, and the backtest averaged about $14 per trade that year, down from its strongest years in 2023 and 2024.
The AI then highlighted how sensitive that result was to execution costs. Each additional five cents of slippage costs $5 per spread. Against an average profit of about $14 per trade, a small increase could erase the remaining profit. Its conclusion: pass.
What to take from this
What made this useful was watching the conclusion change as we asked more questions. Here’s what we did.
- Start with a simple, honest baseline. No filters, no exits, so you can see what each change adds.
- Ask plain questions. “Does the day of the week matter?” “What if VIX gapped up?” You do not need to code.
- Test nearby settings. A wider sweep in the Optimizer helps show how sensitive the result is to the chosen parameter. Remember, the greenest cell in a historical backtest won’t necessarily be the greenest cell in the future. There’s a reason you hear “backtests are backward-looking, not forward-looking” quoted frequently!
- Risk management is critical. Sizing is one of the main pillars of a good risk management structure.
- Check for edge decay. Results can and do change over time. Compare recent performance with earlier periods—and don’t forget to examine how additional slippage affects the backtest across different timeframes.
How to connect AI to Option Omega
The Option Omega MCP lets an AI assistant run backtests, saved tests, and optimizations in Option Omega without clicking through settings. In Claude, setup is three steps:
- Open Claude’s connector settings and choose to add a custom connector.
- Name it (for example, “OO MCP”) and paste the server URL from the Option Omega MCP page.
- Ask Claude to run or analyze a backtest by pasting its URL.
TradeBlocks is free and open source: github.com/tradeblocks-org/tradeblocks.
Ready to test your own ideas? Start a free trial and connect it to AI with the Option Omega MCP. Questions about setup or skills to build? Join the Discord.
Watch the full walkthrough: AI Found Our Options Edge… Then Told Us Not to Trade It.
Backtest results are hypothetical and do not guarantee future performance. Options trading involves substantial risk.