Option Omega Optimizer Launch: Parameter Sweeps, Heat Maps and Robustness
Option Omega launched the Optimizer, its parameter sweep tool. See a live 388-backtest sweep, two-parameter heat maps, the Robustness Score and 7-day storage.
Traders have asked Option Omega for parameter sweeps since 2022. On this launch stream, Troy, Matt and Rusty from Option Omega, joined by Dan Sheridan, showed the result: the Optimizer, which ran 388 backtests at once on a live entry-time sweep.
The stream was about showing how the tool works and how the team reads its results, not about finding a trade: Troy rated the demo backtest “zero out of 10.” For a shorter, step-by-step demo, see Introducing the Optimizer: run 500 backtests at once.
Why parameter sweeps, and why now
Rusty said parameter sweeps had been a constant request since 2022, and for a long time the answer was no. He credited Jordan Brown, who joined the team and worked out the optimization approach in his spare time.
Troy framed the problem the Optimizer is meant to solve. Starting around October 2025, the team heard from traders whose backtests had worked since SPX daily expirations began, then started falling apart. His read is that the market regime has changed, with geopolitics at a new level and single posts that can move the market. The Optimizer, as he put it, is like a Swiss Army knife for taking those backtests apart to see what changed.
The live demo: a 0DTE trade that stopped working
Troy picked a backtest from an earlier community competition. It had worked well from 2013 to 2024, then stopped working almost as soon as that period ended.
The setup, as described on the stream:
| Setting | Value |
|---|---|
| Structure | 0DTE premium selling, one entry per day in the afternoon |
| Premium target | $3 on each side |
| Stop | None. Exits on an underlying price move instead |
| Data | 1-minute, with a healthy amount of slippage |
| Test window | 2026 year to date |
Year to date, it did poorly. Troy rated it “zero out of 10” and said he would not trade it. It was there to show the tool.
Sweep 1: entry time, 388 backtests
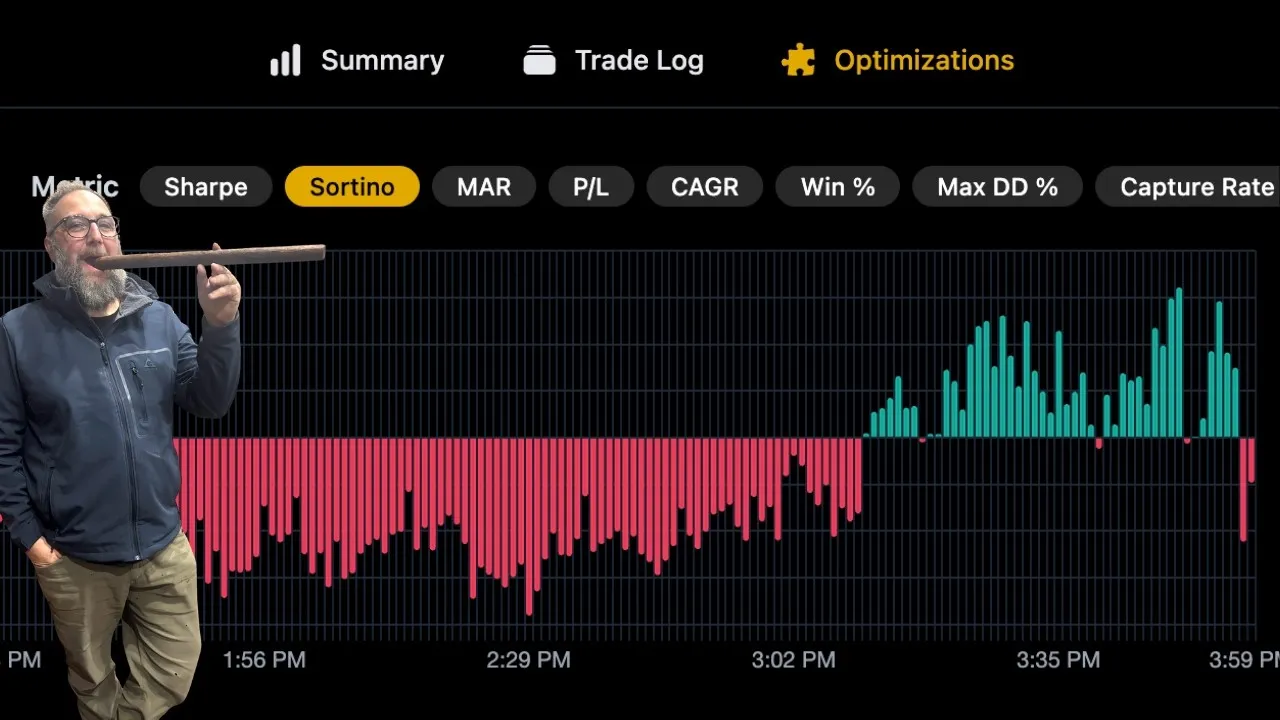
From the saved backtest, Troy opened an optimization on entry time from 9:32 to 3:59, one minute at a time. That is 388 backtests, and they run simultaneously.
Users aren’t limited to one setting. Rusty said they can sweep up to five parameters at a time.
Reading the results: the Robustness Score
Troy explained why the team built a score into the tool. “We know that there’s such thing as curve fit,” he said, and they were concerned people would simply pick the best MAR or best Sortino without understanding what they were looking at.
The Robustness Score judges a sweep on several factors, and you can base it on the metric you choose: MAR, capture rate, Sortino and others. Clicking the score shows the math behind it, and it is covered in the documentation.
On this sweep:
- The chart showed some times of day clearly worked better than others, but the change from one minute to the next was “kind of wonky,” not smooth. That pulled the scores down.
- The row with the best MAR had what Troy called a “pretty suspect” Robustness Score. It was one of only a couple of good minutes, and the area around it was not smooth.
- Other rows scored 9.2 and 9.6 with smaller MARs. Troy said he was personally more interested in a MAR of 17 with a Robustness Score of 9.2.
One of the team preferred to “go hard in the paint” and ran the 34 MAR row anyway. The tool lets you do that. Troy’s point was that the Optimizer leaves the choice to the user, while showing whether a result stands alone or sits in a good area. As he put it, the greenest result “may be luck. That may not be rigor.” A strong score doesn’t rule out overfitting, though.
Later, after a second sweep, Troy made the same point about MAR. A juicy MAR may not repeat. A more consistent 62 MAR, or even a 47 MAR with a high Robustness Score, may be worth more attention.
“Magic minute disease”
Troy asked the panel where they would put three entries a day. One panelist read the chart this way: late morning into early afternoon looked decent, and power hour looked decent but not too late in power hour. He said he would not put stock in any single green minute, and would look for the middle of a good area instead. He suggested 3:31 rather than the half-hour mark, because “a lot of people stampede” right at it.
Troy called the habit of picking one standout minute “magic minute disease.” If one time spikes up while everything around it is red, the chart makes that easy to spot.
Sweep 2: two parameters and the heat map
Next, Troy swept premium on both sides, from $1 to $4 in 25-cent steps, for the put side and the call side. With two parameters, the Optimizer adds views:
- One parameter at a time: a chart for each setting.
- Heat map: both parameters at once, so you can see good and bad areas.
- Parameter impact: which setting causes the biggest change. Here it was the put side.
The well-scoring rows used lower put premium targets and higher call premium targets. Troy found that surprising in an up market. Another panelist said he has seen the same skew across many 0DTE premium-selling backtests, so he did not read it as specific to this one.
How the workflow fits together
The team laid out the rules of the tool on the stream:
- A backtest must be saved before it can be optimized.
- Click the play button on any row in the results table to run that version as a backtest.
- Save the result, replace your previous test if you want, then optimize again on the new version.
- Optimizations are stored for seven days, then they disappear. Rusty said it is built for research. When you find a version that works, you save it as a test.
- Each run has a 20-minute limit, because some runs can get stuck. Very long date ranges may not finish.
The seven-day window and the time limit push toward recent data. Troy noted that some traders re-test the last 90 days, and that Tammy Chambless updates her settings using about the last six months (see her MEIC interview). His view: an optimization from three months ago is old news, and the question is “What’s working now?” A shorter recent window also means fewer trades behind each result.
Dan said the Optimizer seemed like a game changer. In the past, knowing whether double calendars or double diagonals were working meant comparing notes across a community of traders. His guess is that most strategies that stop working are hit by changed conditions rather than being broken for good.
What each plan gets
These were the limits at launch:
| Plan | Tests per optimization | Optimizations per day |
|---|---|---|
| Premium (includes trading) | 500 | 250 |
| Essential | 50 | 10 |
| Plus | 50 | 10 |
Essential and Plus are renamed backtesting tiers. Only the names changed. One of the team noted the gap between plans: about 125,000 tests a day on Premium.
The team said documentation is out, with more optimization content and a Backtesting Boot Camp segment coming.
Key takeaways
- The Optimizer sweeps up to five parameters at once. Entry time alone was 388 backtests from 9:32 to 3:59.
- The Robustness Score is built on the metric you pick and flags results that stand alone, like a top MAR row surrounded by poor minutes. A high score doesn’t rule out overfitting.
- Two-parameter sweeps add a heat map and a parameter impact view. Here, put premium had the biggest effect.
- A test must be saved before it is optimized. Optimizations last seven days, and runs are capped at 20 minutes.
- The team prefers optimizing on recent data and looking for good areas, not “magic minutes.” Results picked that way are still in-sample until checked on later data.
Run your own sweep. The Optimizer is part of the Option Omega backtester, and 1-second stop data is covered in 1-second IMSL data and faster backtesting. Start a free trial, and share what you find in the Discord.
Watch the full video: You Asked For This For Years. Monday It’s Yours..
Backtest results are hypothetical and do not guarantee future performance. Options trading involves substantial risk.