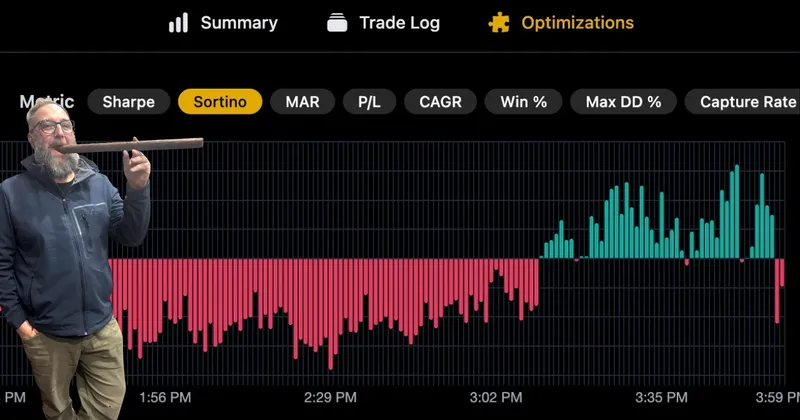
Option Omega Optimizer: Run 500 Backtests at Once and Test the Concept
The Option Omega Optimizer sweeps up to 5 parameters at once. Matt ran 700+ backtests in about 10 minutes on an iron condor losing year to date.

An iron condor that had been profitable every year since SPX daily expirations was losing in 2026, year to date at the time of the video. Rather than guess at what to change, Matt from Option Omega ran 388 backtests at once, one for every entry minute of the trading day, then a few hundred more on premium. It was live and unrehearsed, on a backtest Troy had never seen. More than 700 backtests later, in about 10 minutes, Matt had two saved versions that did better year to date and a clearer view of which settings the results depended on.
OO built the Optimizer to answer a question the team kept hearing: “I don’t know what to trade anymore.”
What the Optimizer does
The Optimizer runs a parameter sweep. Users pick a setting, give it a range and a step, and Option Omega runs a backtest for every value in that range at the same time. Users can sweep up to five parameters at once, such as entry time, premium and profit target.
It lives in a new Optimizations tab. From a saved backtest, users click Optimize, choose the date range and the parameters, and run it. Results come back as a table and a chart, and users can turn any row into a backtest with one click.
How much users can run depends on their plan. These were the limits at launch:
| Plan | Optimizer access | Optimization runs per day | Tests per optimization |
|---|---|---|---|
| Lite | Modeling only, no Optimizer | n/a | n/a |
| Essential | Backtesting + Optimizer | 10 | 50 |
| Plus | Backtesting + modeling + Optimizer | 10 | 50 |
| Premium | Backtesting, modeling, automation + full Optimizer | 250 | 500 |
| Trial | Optimizer | 1 | 50 |
The problem: an iron condor that stopped working
Matt picked a plain iron condor with a single entry time, traded every day except Thursday. He called it “a very common thing that people would have traded.”
Run over 2025, it did fine. Not exciting, but it finished the year close to its all-time high. Run year to date in 2026, it was losing. Matt said it was the first year since SPX dailies that the backtest had not been profitable. (“You know who likes this backtest? The brokers.”) Troy added that he knew of traders who’d had a rough July, a rough June, and in some cases a rough May.
Step 1: Sweep every entry minute (388 backtests)
The first optimization swept entry time from the open to the close, one minute at a time, year to date. That is 388 backtests, each one using 1-second data to check for stop-outs, with slippage included, still trading every day but Thursday.
The results were not pretty. Troy’s first read of the chart: the winners were “little bitty valleys in the midst of mountains of losses.” To him, that meant the test wasn’t robust, because the winning minutes were “very few and far between.” Picking one of those isolated minutes would mean leaning on a result that depends heavily on one exact setting.
How the Robustness Score works
The Robustness Score is meant to flag exactly that situation: good results that depend on one isolated setting. In Troy’s words, it looks at the whole parameter sweep and checks whether the good results are “in a valley by themselves,” or whether the winners sit in a neighborhood together. The score has four parts:
- Retention and plateau: Troy described these together, as how many of the winners sit near each other instead of standing alone.
- Smoothness: how gradually performance changes from one parameter value to the next. Sharp jumps between neighboring values pull the score down.
- Multi-metric: with only one metric selected, as in this demo, Troy said this part would come out fine.
You choose which metric the score is built on. The demo had Sortino selected, and you can switch to another, such as MAR. The results can be sorted in the table or viewed on the chart.
On this first sweep, the score pointed the same way as the chart. As Matt put it: “This is not a great test.”
Worth keeping in mind: a high score tells you a good result has good neighbors. It doesn’t rule out overfitting, and every sweep in this demo was scored on the same year-to-date window the settings were chosen from.
Step 2: Sort by capture rate and save V1
Switching the view to capture rate looked a little better. There were some good entry times in the morning and a few other clumps of good minutes.
Matt sorted by robustness, clicked Create backtest from this test, and ran it. The new version had a positive capture rate year to date: 6.4%. He saved it as V1. An improvement, but he thought it could do better.
Step 3: Sweep premium on both sides (about 300 backtests)
The original condor started with $2 of premium on each side. Matt’s question: was $2 at this entry time the only thing that worked this year, or was there a broader area of good results?
He ran a second optimization on a couple of parameters at once, about 300 backtests. As he put it:
“We want to test concepts. We want to test strategies. We don’t want to just test a configuration.”
Troy’s read of the new chart: “comprehensively better” than the first sweep. There was a clear clump of good results where both sides used a bit more premium than $2. Matt clicked a result in the middle of that clump, which had a Robustness Score of 8.1, and ran it. The capture rate rose to 10.4%. He saved it as V2.
| Saved test | What changed | Capture rate (2026 year to date) |
|---|---|---|
| Original | Single entry time, $2 premium per side | Losing year to date |
| V1 | Entry time picked from a greener clump in the minute sweep, sorted by Robustness Score | 6.4% |
| V2 | Higher premium on both sides, picked from the middle of a cluster (Robustness Score 8.1) | 10.4% |
Matt picked from the middle of the clump rather than the single best row. Nearby settings also did well, suggesting the result was less dependent on one exact premium.
Step 4: Re-test entry time to check the concept
One more check. With the higher premiums in place, Matt went back to entry time and swept again, minute by minute, through the morning up to midday. That was 148 backtests.
The question: did the higher premiums work at more than one minute? In this year-to-date sweep, they did. There were clear clumps of good results, including one early in the day, “right before the news breaks,” as Matt described it. Sorting the results, 9:32 and 11:14 both stood out. On the chart, 11:14 sat inside a later group of good minutes. Running the backtest at 11:14, MAR was a little higher and capture rate a little lower than V2.
The workflow Matt followed
- Started from a saved test that had stopped working year to date.
- Swept one key setting widely: every entry minute, over 2026 year to date.
- Read the Robustness Score and the chart, not just the top row, looking for clumps of good results rather than isolated spikes.
- Saved the improvement as a new version (V1), then swept the next settings and saved V2.
- Went back and re-checked entry time with the new premiums, to see whether they held up at more than one minute.
The same steps work on any saved backtest in OO. One limit of this demo: V1 and V2 weren’t tested on a period outside the one they were picked from, so their year-to-date numbers describe how they fit that window, not how they’d do next.
This demo used 1-second data to check stop-outs, covered in 1-second IMSL data and faster backtesting. For a deeper look at how the team thinks about robustness and recency, see the launch stream walkthrough.
Key takeaways
- The Optimizer sweeps up to five parameters at once. At launch, Premium allowed up to 500 backtests per optimization; Essential, Plus and Trial allowed 50.
- A sweep of every entry minute (388 backtests) showed the original iron condor’s good entry minutes were scattered, and the Robustness Score rated the sweep poorly.
- The Robustness Score rates retention, plateau, smoothness and multi-metric strength, using the metric you choose. A strong score shows a result has good neighbors; it doesn’t rule out overfitting.
- In this year-to-date backtest, V2 (higher premium on both sides, picked from the middle of a cluster) had a 10.4% capture rate versus 6.4% for V1.
- More than 700 backtests ran in about 10 minutes. Matt’s aim, in his words, was to “test concepts,” not just one configuration.
Try it on your own saved tests. The Optimizer is part of Option Omega’s backtester. Start a free trial to run your first optimization.
Watch the full video: Introducing the Optimizer: Run 500 Backtests at Once.
Backtest results are hypothetical and do not guarantee future performance. Options trading involves substantial risk.